Learn / Databases, past the CRUD layer
Query plans and N+1
Lesson 7 of 37 · 9 min read ·
What it is
EXPLAIN shows you the plan the database intends to use. EXPLAIN ANALYZE actually runs the query and shows what happened. The second is what you want — the first is an estimate, and estimates are exactly what go wrong.
Reading a plan in sixty seconds
Read it inside-out and bottom-up: the most indented node runs first and feeds its parent.
Nested Loop  (cost=0.29..842.71 rows=100 width=48)
             (actual time=0.05..812.4 rows=5000 loops=1)
  ->  Seq Scan on orders  (actual time=0.01..2.1 rows=5000 loops=1)
  ->  Index Scan using users_pkey on users
        (actual time=0.15..0.15 rows=1 loops=5000)
Four things to look at, in this order:
actual timeon each node. The top number is startup, the second is total. Find where the time is.rowsestimated vs actual.rows=100estimated againstrows=5000actual is a 50× misestimate — the planner chose a Nested Loop based on a wrong guess. That usually means stale statistics; runANALYZE.loops.loops=5000means that node ran 5,000 times, and itsactual timeis per loop. 0.15 ms × 5,000 = 750 ms. This is where the time went.- Access method.
Seq Scanon a big table with a selectiveWHEREmeans a missing or unusable index.
Join strategies
- Nested Loop — for each outer row, probe the inner. Great when the outer side is tiny; disastrous when the planner underestimates it.
- Hash Join — build a hash table of one side, stream the other. The usual choice for large unsorted joins.
- Merge Join — both sides sorted, walk them together. Good when indexes already provide the order.
You do not choose these. But when a query is slow and the plan shows a Nested Loop over thousands of rows, you now know the story: the estimate was wrong.
N+1
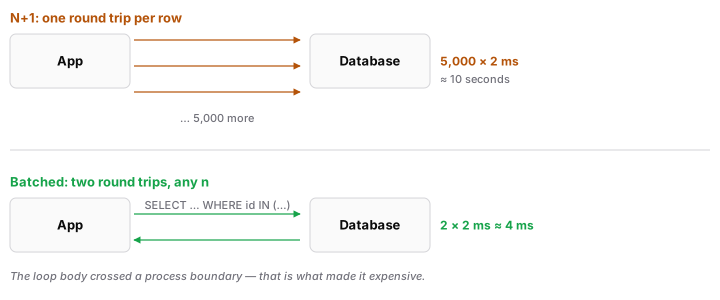
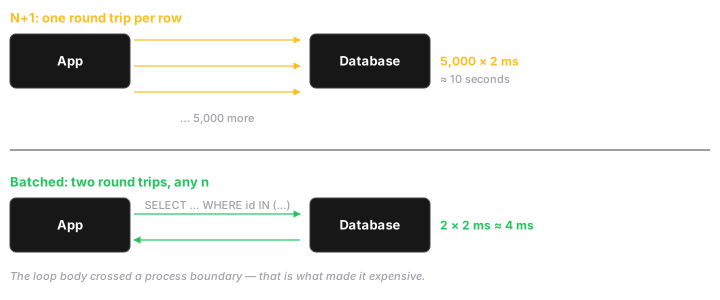
The plan above has an application-layer twin. One query fetches 100 posts; then your ORM lazily loads each post's author, one query at a time. 1 + 100 queries, each with its own round trip.
It is invisible in code review because the offending line looks like a property access:
posts.forEach(p => console.log(p.author.name)) // 100 queries hide here
Fixes: eager-load the relation (include / joinedload / .populate()), or fetch the ids and batch them in one WHERE id IN (...). This is the same shape as Big-O in production — work inside a loop that crosses a process boundary.
The reliable way to catch it is to log query counts per request in development. An endpoint that issues 143 queries announces itself immediately.
Gotchas
EXPLAIN ANALYZEexecutes the query. Wrap writes inBEGIN ... ROLLBACK.- Plans depend on data volume. A plan derived on 100 dev rows tells you nothing about 10 million.
LIMITchanges the plan — the planner may pick a slow-start-but-fast-first-row path.OFFSET 100000still reads and discards 100,000 rows. Use keyset pagination (WHERE id > last_seen).SELECT *prevents index-only scans and drags unnecessary bytes across the wire.
Prove you know it
Instrument query counts on one endpoint. If it makes more queries than it returns entities, you have an N+1. Fix it with eager loading and confirm the count drops to a small constant.