Learn / Fundamentals, the production version
Memory in a managed runtime
Lesson 3 of 37 · 8 min read ·
What it is
A garbage collector frees memory that your program can no longer reach. "Unreachable" is the key word — not "unused". If any live reference chain still points at an object, the GC must keep it, however uselessly you are holding it.
That single distinction explains every memory leak in a managed runtime.
Why it bites
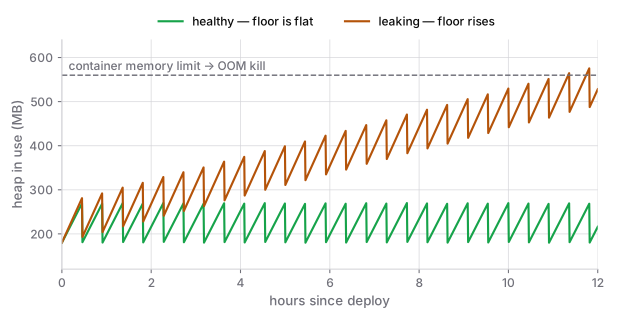
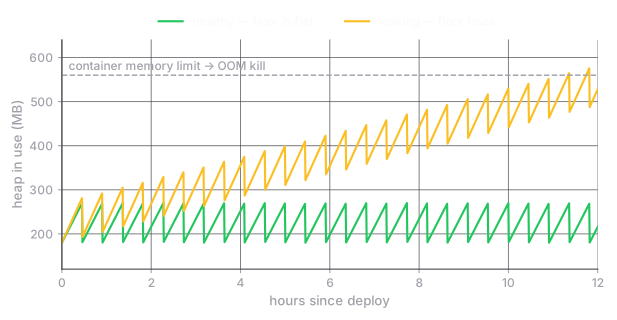
A leak in Node or the JVM does not crash immediately. It looks like this: memory climbs slowly over hours, GC runs more often, pauses get longer, p99 latency creeps up, and eventually the container hits its memory limit and gets OOM-killed. The restart clears it, so the graph looks like a sawtooth. Teams live with sawtooth graphs for months without recognising them as a bug.
The usual culprits:
- A module-level
Mapor array used as a cache, with no size bound and no eviction. Every key ever seen is still reachable. - Event listeners registered and never removed — the emitter holds the closure, the closure holds everything it captured.
- Timers (
setInterval) that are never cleared. - Closures capturing a large object when they only needed one field from it.
- Request-scoped data appended to a long-lived logger or context object.
The mental model
Generational GC assumes most objects die young. New allocations go in a small young generation collected very frequently and very cheaply. Anything that survives a few collections gets promoted to the old generation, which is collected rarely and expensively.
Two consequences worth remembering:
- Short-lived garbage is nearly free. Do not contort your code to avoid allocating temporary objects; that is the case the GC is optimised for.
- Long-lived garbage is the expensive kind. An object you accidentally keep alive gets promoted, and then it is only reclaimed during a major collection — the kind with the long pause.
Finding a real leak
Guessing is a waste of a day. Take two heap snapshots — one at a steady state, one after an hour of traffic — and diff them. In Node, node --inspect plus Chrome DevTools' Memory tab does this; the JVM has jmap plus Eclipse MAT. Sort the diff by retained size, take the top growing constructor, and look at its retainer chain. The chain names the exact reference keeping it alive, which is usually a variable you recognise instantly.
Gotchas
- Set a container memory limit and tell the runtime about it (
--max-old-space-sizein Node). A runtime that thinks it has the whole host will happily let the kernel kill it. - Rising memory is not automatically a leak. It may just be a heap that has not needed collecting yet. Look for a rising floor after GC, not a rising peak.
- Streaming beats buffering. Reading a 2 GB file into a string is not a leak, but it will still take the process down.
- A cache without a size bound is a leak with better PR. See caching and invalidation.
Prove you know it
Take any service you run and answer: what is its heap ceiling, what happens when it is reached, and which structure in it grows with traffic and has no bound? If you cannot name the bounded structures, you cannot claim it does not leak.