Learn / Fundamentals, the production version
Networking past the OSI chart
Lesson 4 of 37 · 8 min read ·
What it is
The OSI model tells you where things sit in a stack. It tells you nothing about why your API call took 400 ms. This is the layer that explains that.
The cost of a single HTTPS request
Before your server sees one byte of the request:
- DNS — up to ~50 ms if uncached, ~0 if cached.
- TCP handshake — one round trip.
- TLS handshake — one more round trip with TLS 1.3, two with 1.2.
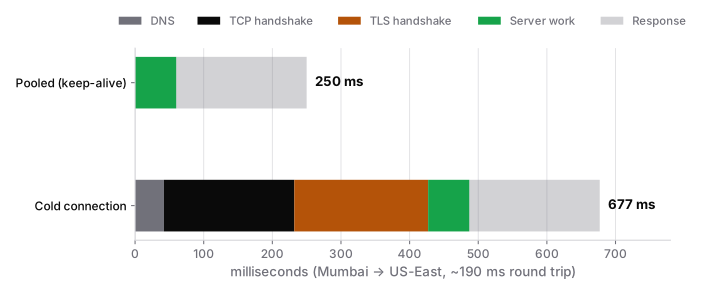
Round trips are dominated by physical distance. Mumbai to a US-East server is roughly 200 ms per round trip; nothing you write in application code changes that. So a cold HTTPS request costs 2–3 round trips before any work happens — around 600 ms on that route. The same request on a warm, pooled connection costs one round trip.
That is the whole argument for connection pooling and keep-alive: you pay the handshake once instead of every call.
Connection pooling and keep-alive
Creating a fresh connection per request is the single most common self-inflicted latency wound in backend code. Node's default HTTP agent historically did not keep connections alive; many database clients create a new connection per query unless configured otherwise.
Pool sizing has a floor and a ceiling. Too small and requests queue for a connection. Too large and you exhaust the database's connection limit — Postgres allocates memory per connection, and 500 idle connections will hurt it more than they help you. A pool of 10–20 per instance is a sane starting point; the real number comes from measurement.
Why p99 is a different story from p50
Averages hide everything. If 99 requests take 50 ms and one takes 5 seconds, the average is 100 ms and looks fine — but if a page makes 20 backend calls, the chance that at least one of them hits that slow tail is high. Tail latency compounds with fan-out, which is why user-visible slowness is usually a p99 problem, not a p50 problem.
Common causes of a bad tail: GC pauses, a cold connection, connection-pool queueing, a retry after a timeout, one slow shard, or a noisy neighbour.
Always look at p50, p95 and p99 together. p50 tells you the typical experience; p99 tells you what a busy user actually feels.
Gotchas
- Every outbound call needs an explicit timeout. Most client libraries default to none, and a hung connection holds a worker until it dies. See timeouts and retries.
- Bandwidth improves; latency does not. Physics sets a floor.
- Deploy close to your database. An extra 80 ms per query, times 30 queries, is the entire request budget.
- A CDN removes round trips by moving content nearer, which usually beats making the payload smaller.
- HTTP/2 multiplexes many requests over one connection, so head-of-line blocking moves down to TCP.
Prove you know it
Run curl -w "dns:%{time_namelookup} connect:%{time_connect} tls:%{time_appconnect} ttfb:%{time_starttransfer} total:%{time_total}\n" -o /dev/null -s https://your-api/endpoint, then run it again immediately. Explain why the second run is faster and exactly which number dropped.