Learn / Infrastructure and deployment
Observability
Lesson 22 of 37 · 10 min read ·
Monitoring vs observability
Monitoring answers questions you thought of in advance — CPU, error rate, request count. Observability is whether you can answer questions you did not think of, from data already collected, without shipping new code.
The test is concrete: at 2 a.m., a customer says checkout is slow for them specifically. Can you find out why with what you already have? If the answer is "I'd add some logging and redeploy", you have monitoring, not observability.
The three signals
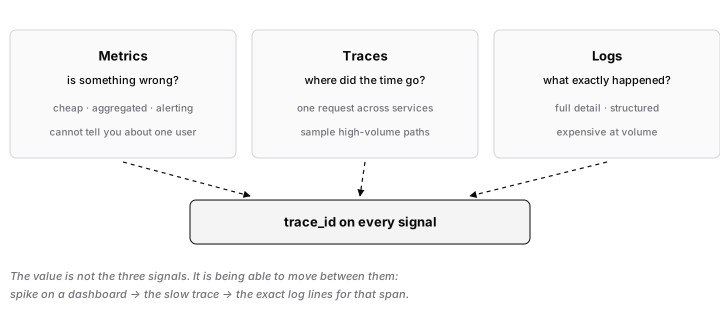
Logs — discrete events with context. Cheap to produce, expensive to store at volume, unbeatable for detail.
Make them structured. Not:
console.log(`User ${id} failed checkout: ${err.message}`)
but:
logger.error({ event: 'checkout_failed', user_id: id,
               order_id, amount, error: err.message,
               trace_id }, 'checkout failed')
Grepping free text works until you need "all failed checkouts over ₹5,000 last Tuesday". Structured logs make that a query. Include a trace_id on every line — that is what ties a log to everything else.
Metrics — numeric aggregates over time. Cheap to store, perfect for dashboards and alerts, and they cannot tell you about one specific user.
The cardinality trap matters here: every unique label combination is a separate time series. A user_id label with a million users is a million series and will take down your metrics backend. Labels are for low-cardinality dimensions — endpoint, status code, region.
Traces — the path of one request across services, as a tree of timed spans. This is what makes a distributed system debuggable. A trace answers "where did those 800 ms go?" instantly: 40 ms in your handler, 730 ms waiting on a downstream call, 30 ms rendering.
Traces are the signal most teams lack and most benefit from. OpenTelemetry is the vendor-neutral standard; instrument with it and you can change backends later.
The four golden signals
For any user-facing service, from the Google SRE book:
- Latency — as p50/p95/p99, never as an average. And measure failed requests separately, or fast errors will flatter your numbers.
- Traffic — requests per second.
- Errors — rate, split by cause.
- Saturation — how full the constrained resource is: connection pool usage, queue depth, memory headroom.
Saturation is the leading indicator. It rises before latency does, which makes it the one worth alerting on early.
Alerting
Alert on symptoms, not causes. "p99 latency above 2 s for 5 minutes" is a symptom users feel. "CPU above 80%" is a cause that may be entirely fine. Alerting on causes produces noise; noise produces ignored pages; ignored pages produce missed outages.
Every alert should be actionable, urgent and documented. If the response is "acknowledge and move on", delete the alert. Alert fatigue is the actual failure mode of most monitoring setups — one team's ignored alert is how a small incident becomes a long one.
Define SLOs and alert on burn rate: "99.9% of requests succeed over 30 days" gives an error budget, and you page when you are consuming it fast enough to exhaust it.
Correlation is the whole point
Three signals in three disconnected tools is three times the work. The value comes from moving between them: a latency spike on a dashboard → a slow trace from that window → the exact span → the logs for that span, with the same trace_id.
Propagate the trace context (the traceparent header) through every service, every queue message and every background job. A queue that drops trace context breaks the chain exactly where debugging is hardest.
Gotchas
- Never log credentials, tokens, card numbers or personal data. Logs are widely readable and retained for a long time.
- Sample traces on high-volume paths — 1–10% is normal — but always keep errors and slow requests.
- Log levels need discipline:
errormeans someone should look,warnmeans it is degraded,infois business events,debugis off in production. - Add a
request_idto error responses so a user's screenshot becomes a searchable key.
Prove you know it
Take your last production bug and ask what would have told you the cause in under five minutes. Then add exactly that — usually a trace, or one structured log line with the right fields. Repeat after each incident; that loop is how observability actually gets built.